

All the weather of the flight, on a single map.
A web application for weather situational awareness, built for the iPad in the cockpit. Need the runway in use, the wind, the reflectivity, the top of a cell? Look at the map.
Not certified — never a primary source
Met2Pilot is neither certified nor approved by any civil aviation authority. It is not airborne equipment and it replaces no official document. It must never be used for navigation, for separation or for avoidance. Flight preparation and conduct remain the sole responsibility of the pilot in command.
01 — Observation
The weather
as it is.
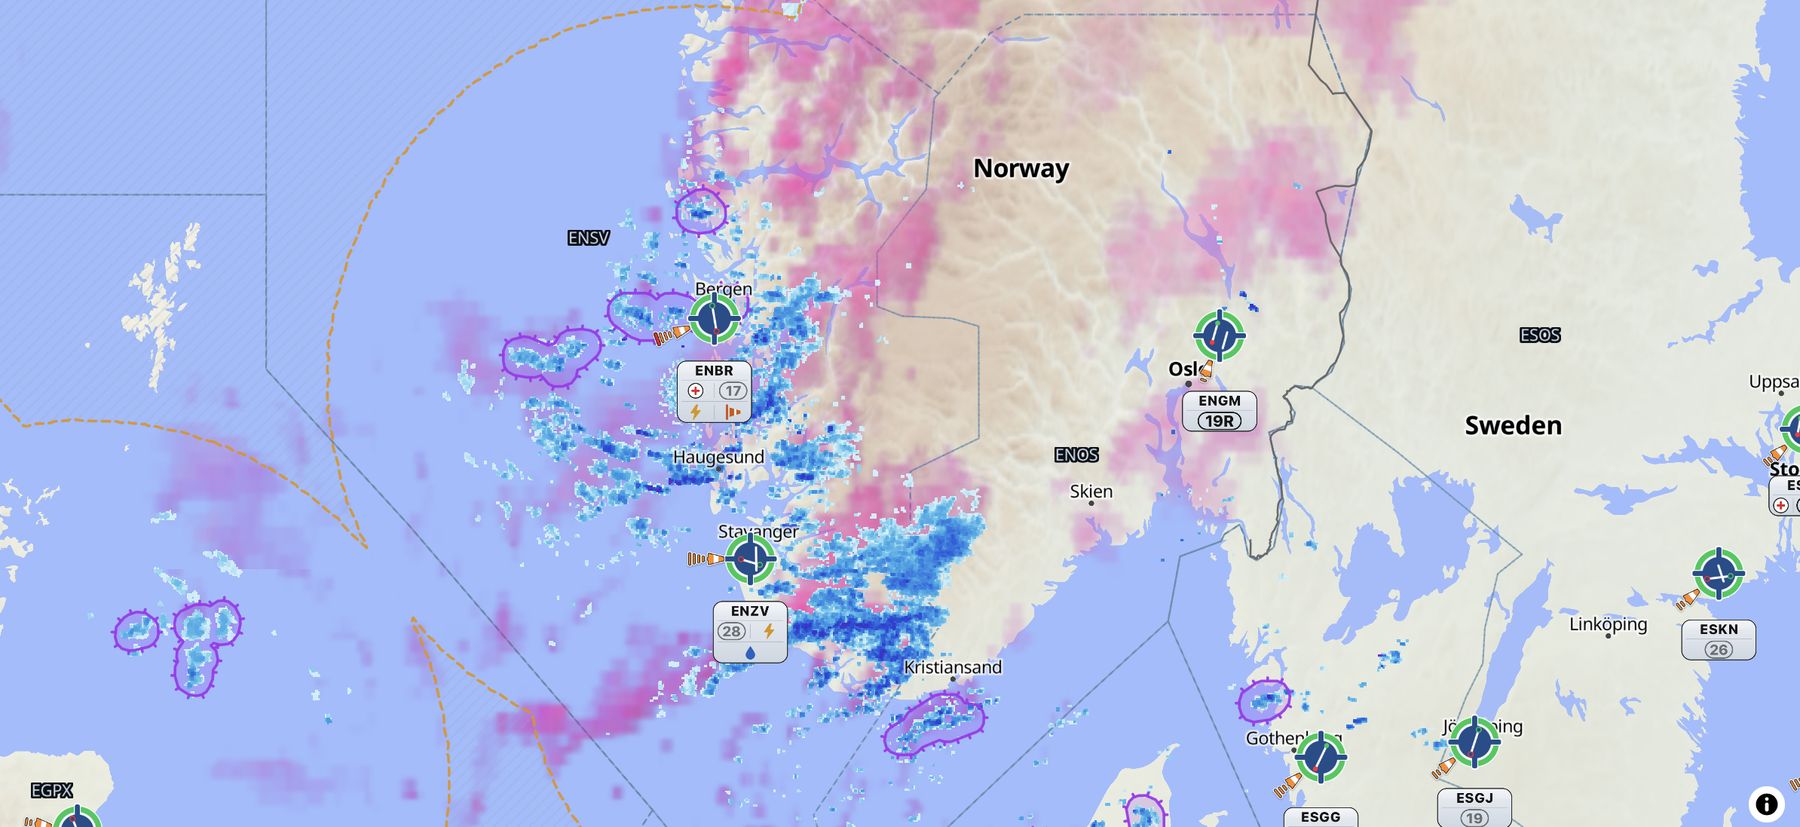
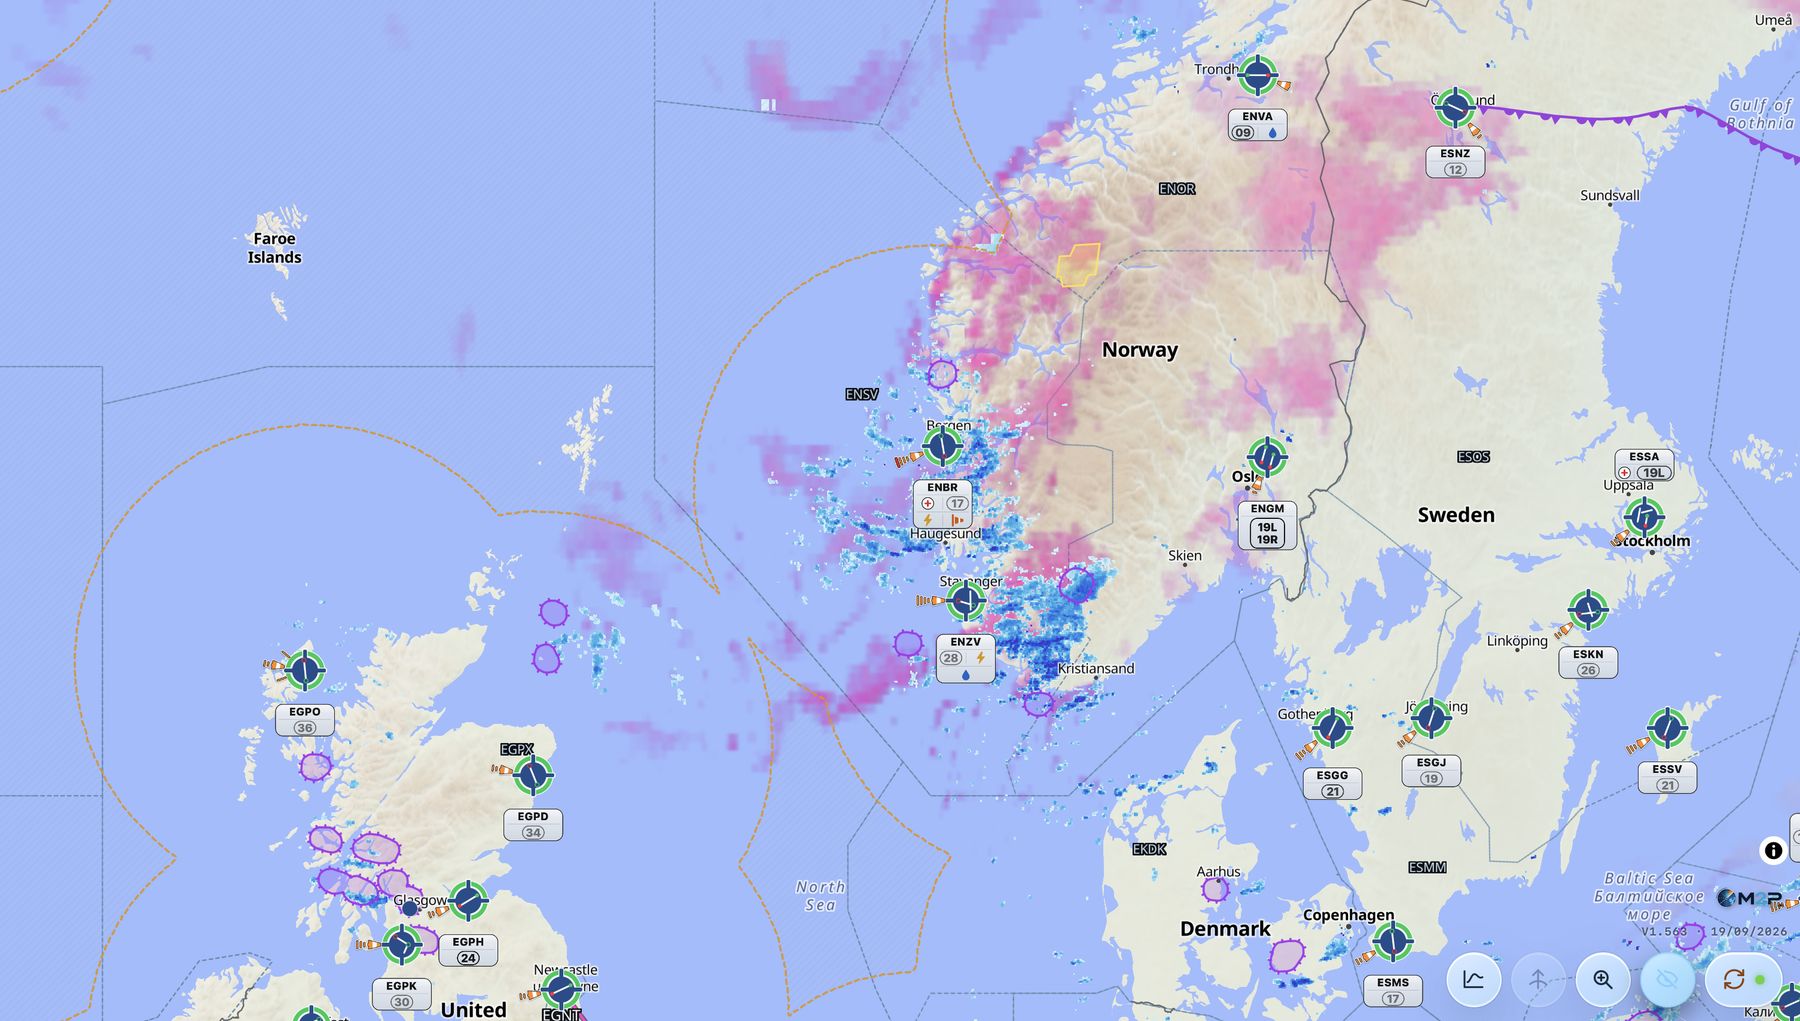
Reflectivity, convection, electrical activity. Mosaics are rebuilt on the client side and repainted to a single palette, so that a cell reads the same way from one layer to the next.
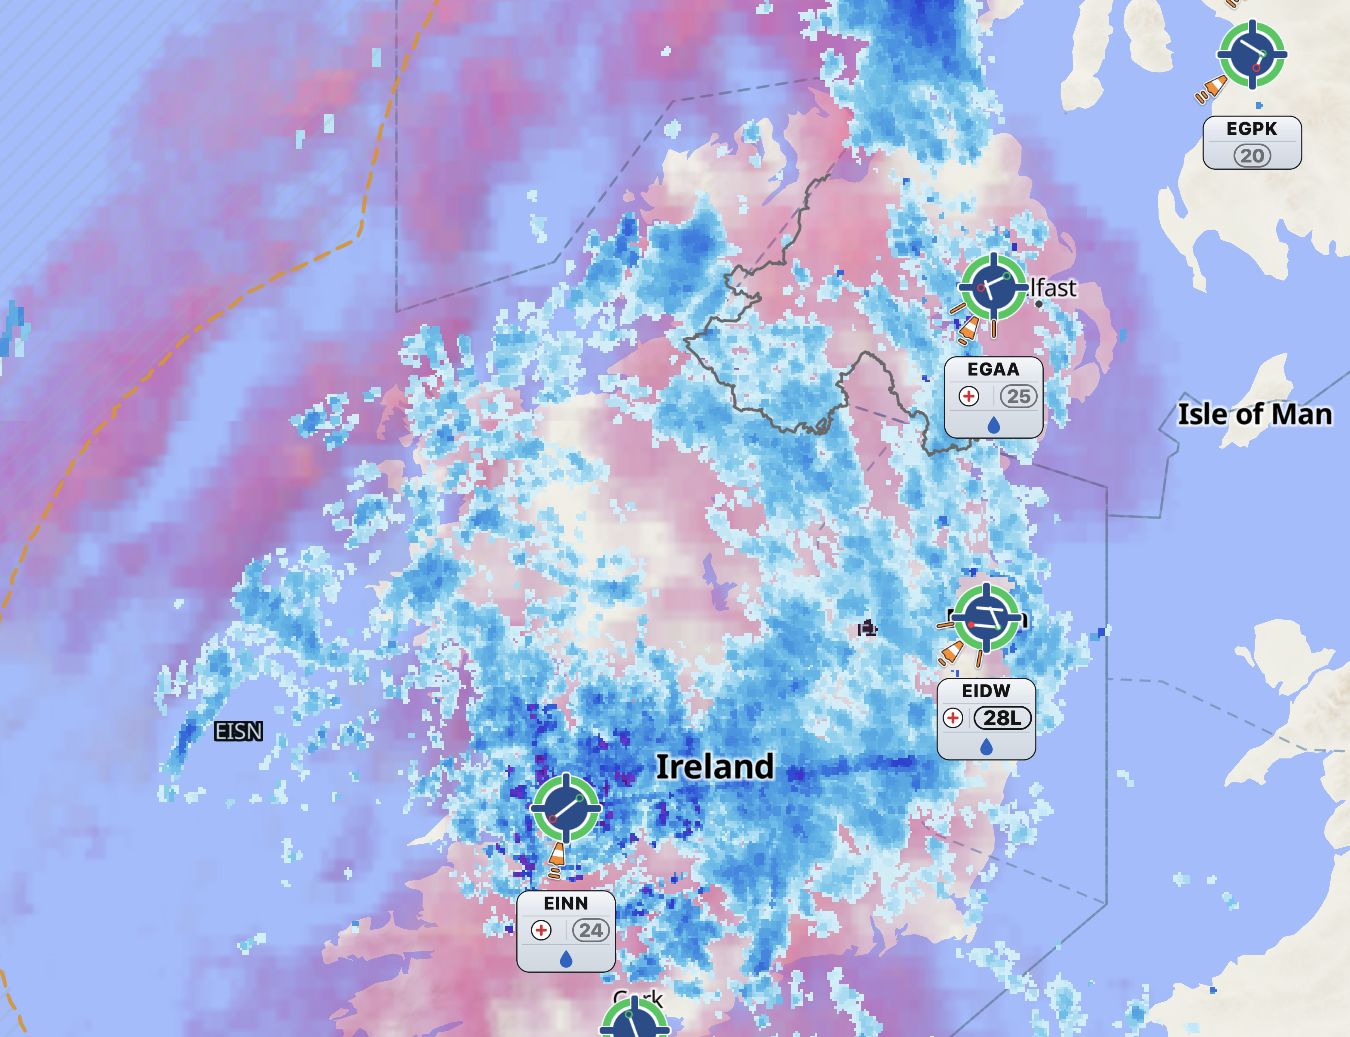
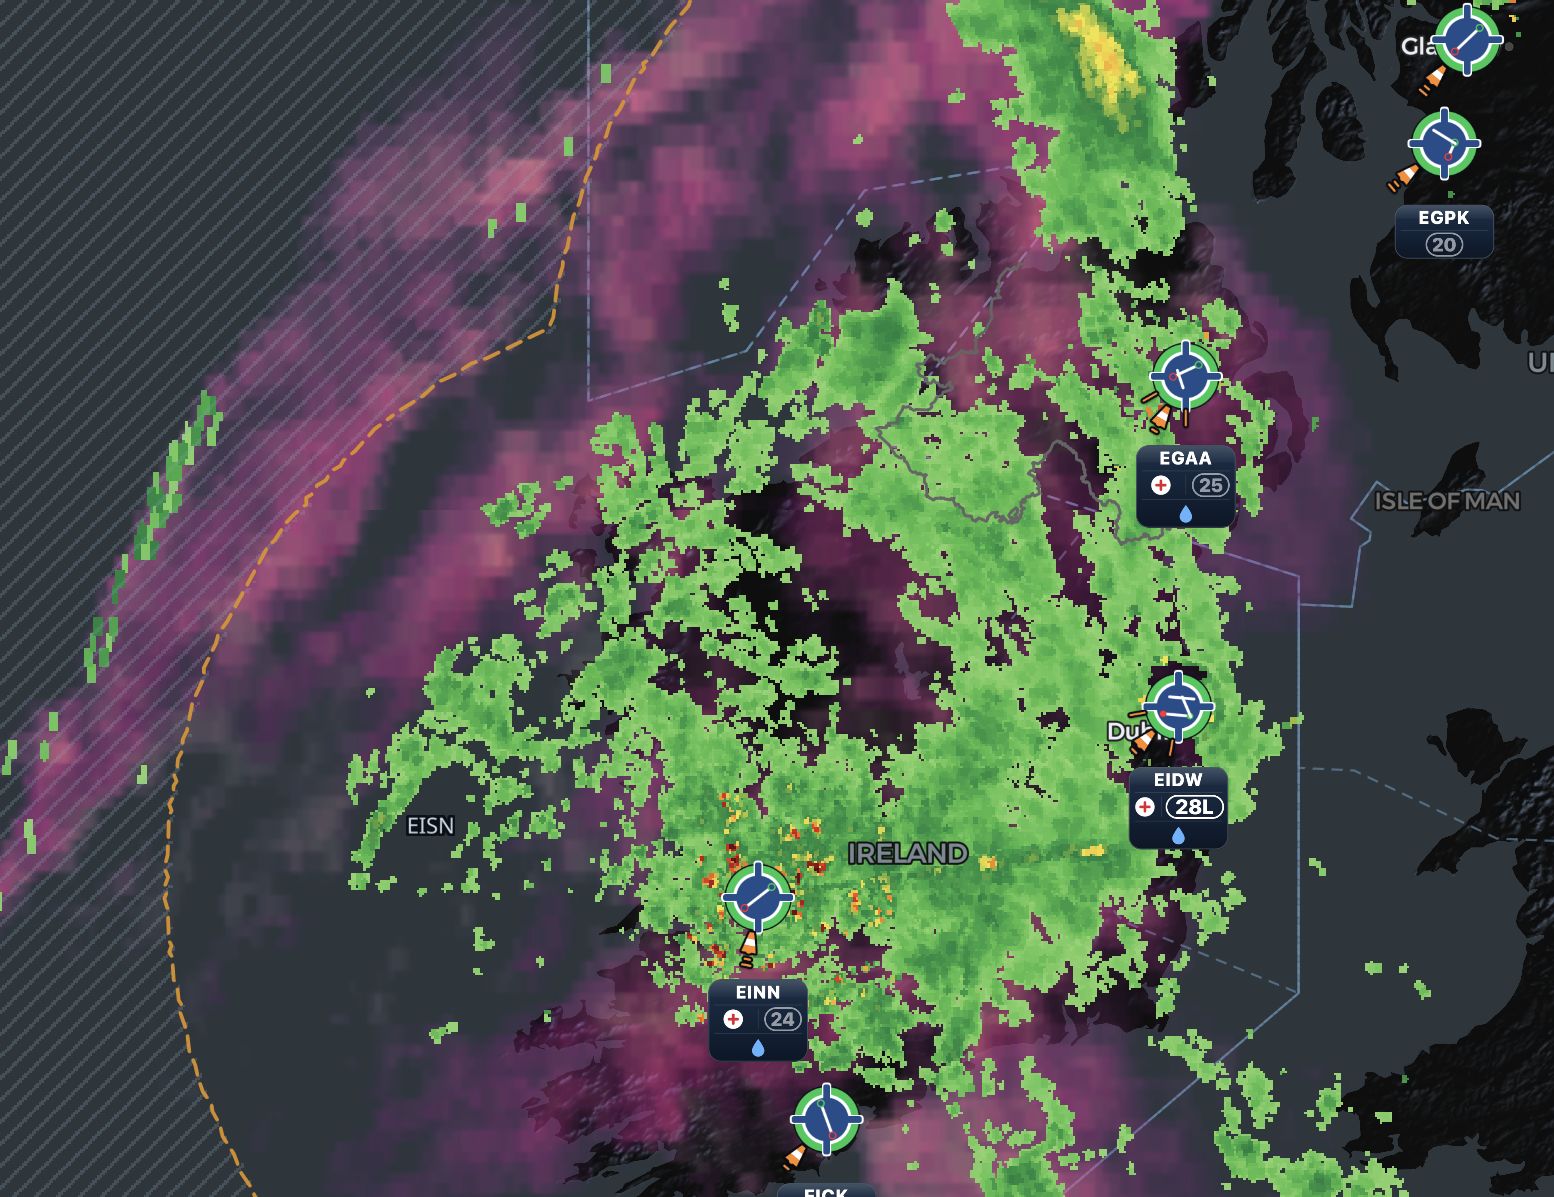
European radar reflectivity
The EUMETNET OPERA mosaic, reprojected and served as a single canvas. Classed palette, adjustable threshold and opacity, intensity modulated by the radar quality index.
Satellite rainfall rate
Rainfall rate in mm/h estimated from the infrared channels of five geostationary satellites. It observes cloud tops, not the rain itself: it fills gaps in radar coverage without standing in for it.
Convection and storm cells
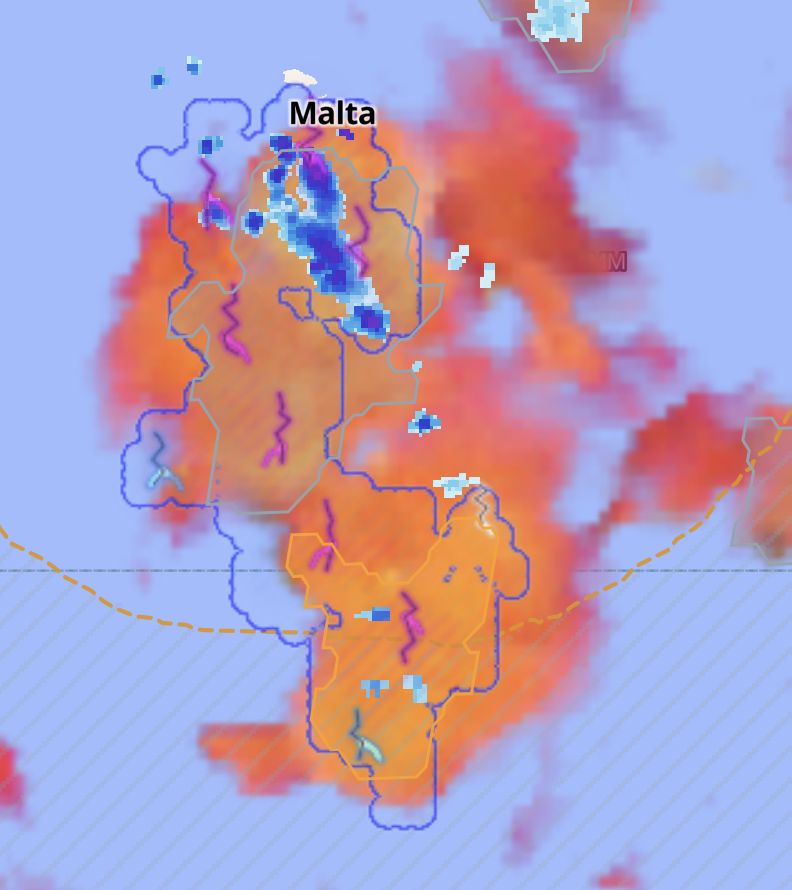
Contrast between satellite channels makes rapidly rising tops stand out in yellow. RDT detection identifies each cell as an object, with its life-cycle stage.
Electrical activity
Optical flash area seen from above, accumulated over 5 minutes. Neither a ground-strike location product nor a flash count — and the interface says so.
Fronts
Human analysis of surface pressure patterns, from which fronts are extracted. The drawing is not an automated product.
Wind at cruise level
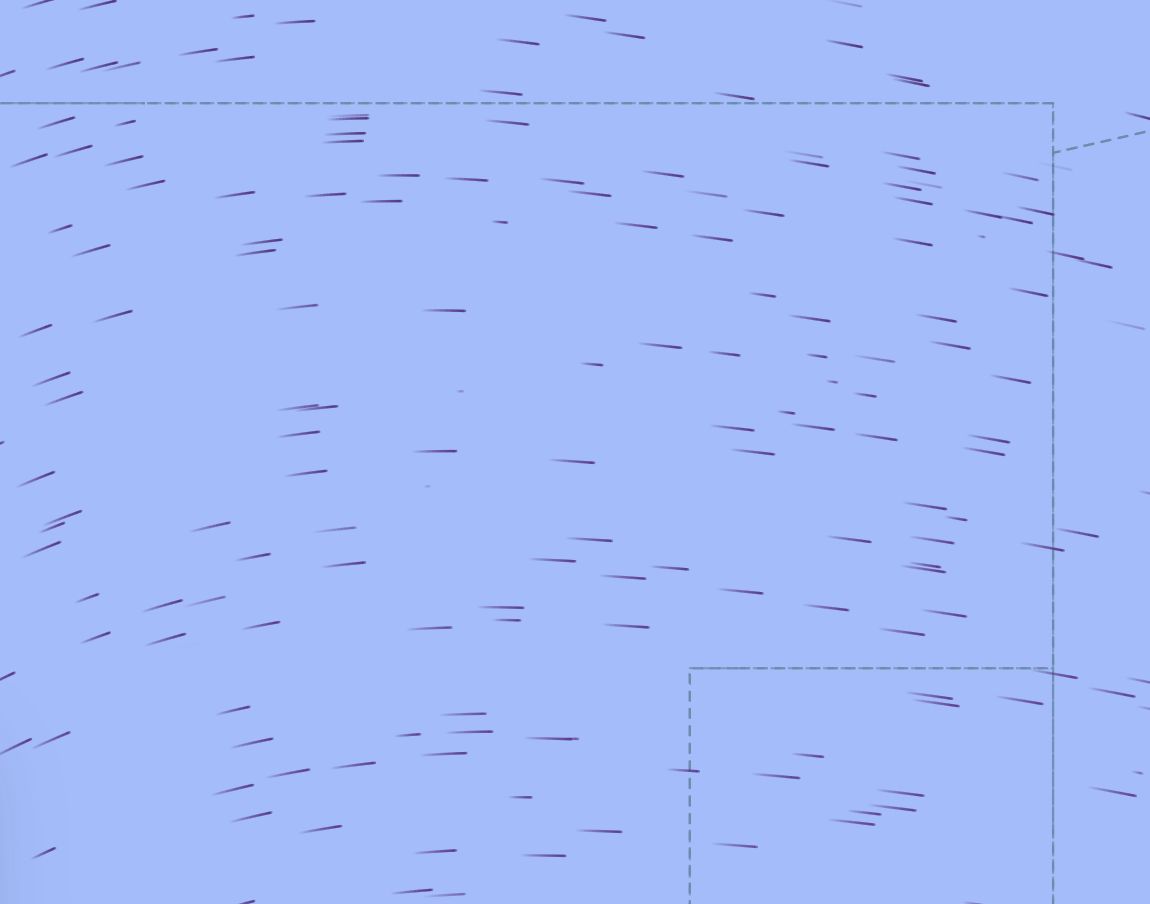
Forecast wind grid at pressure levels, from FL 240 to FL 450. Overlaid on the route, it gives the component on each segment at a glance.
Cloud top
How high does
the cell go?
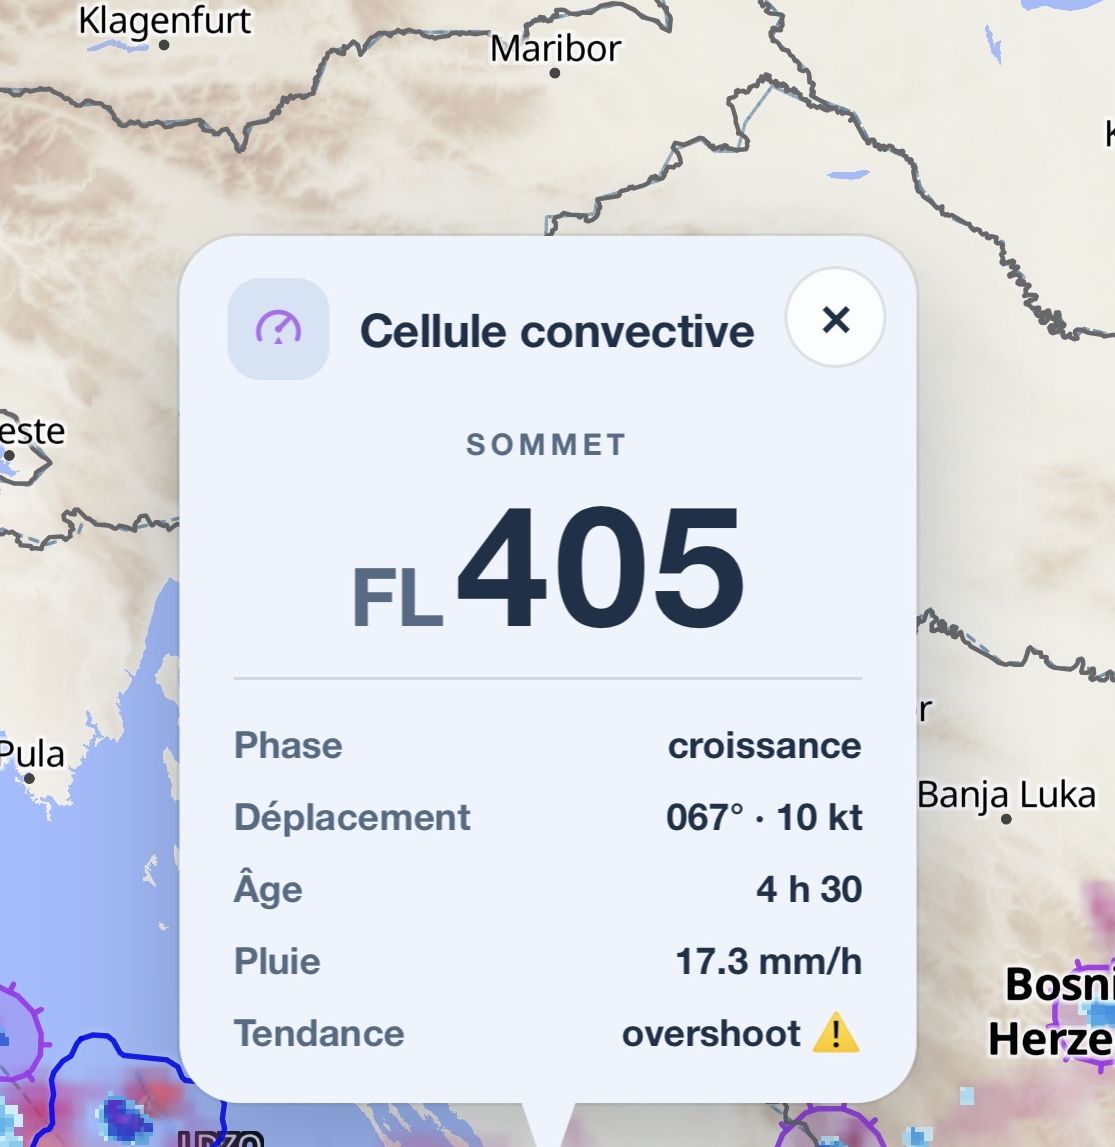
Tap it. The top appears as a flight level, together with the cell's stage, its movement, its age, the rainfall rate and its trend — including the overshoot warning when the top punches through the tropopause.
This is the question that decides between overflying and going around it, and it is settled with a finger rather than an estimate.
02 — Forecast
The weather
to come.
The radar mosaic runs 7 to 12 minutes behind publication. Extrapolation closes that gap, and the app displays the true age of what it is showing.
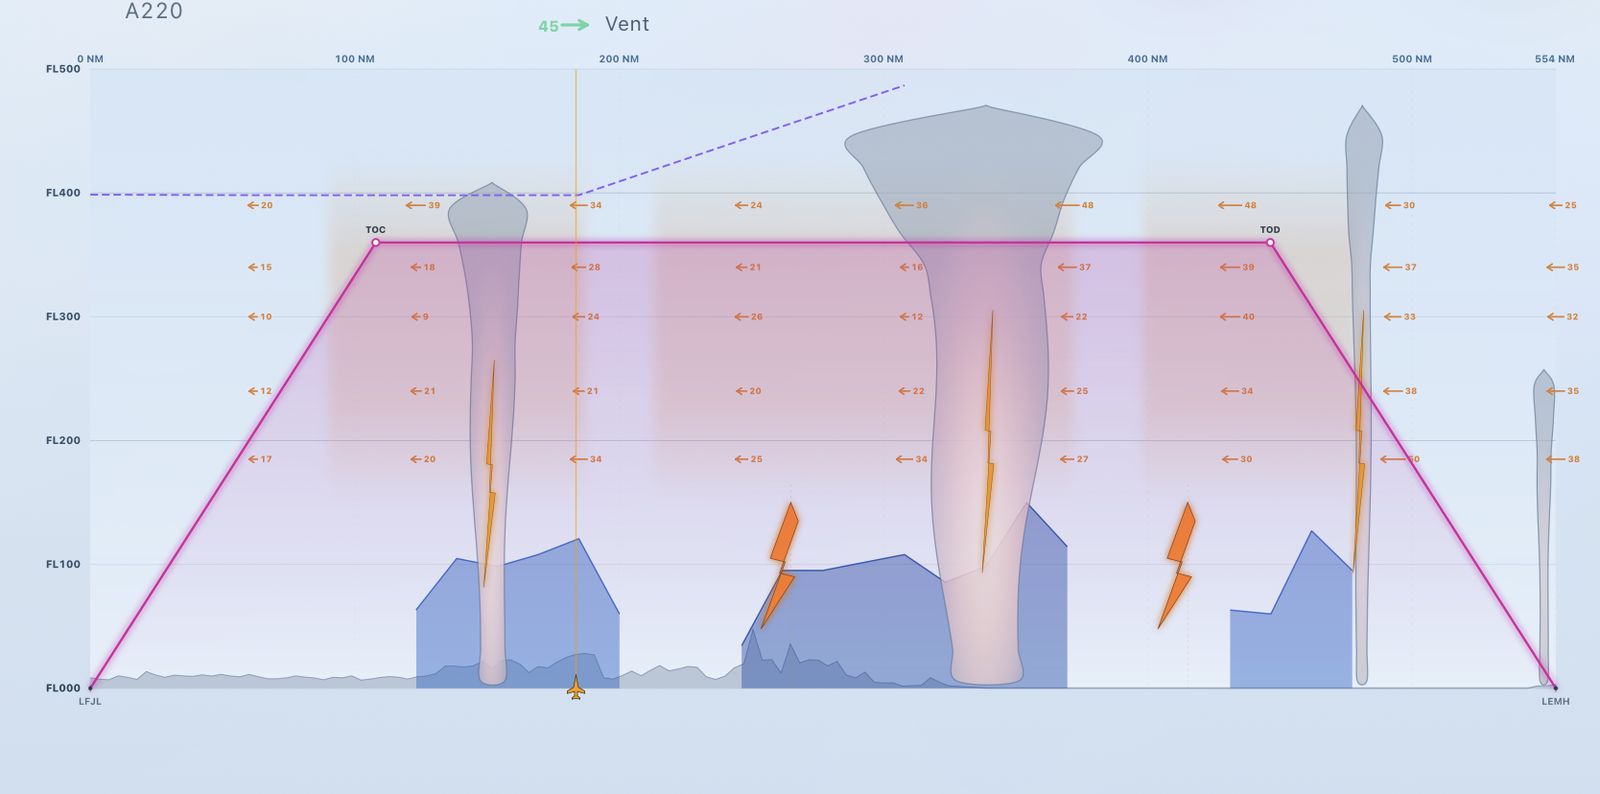
Vertical cross-section along the route
The flight seen from the side: terrain, cells, convection zones, precipitation and isotherms stacked along the track. The view that answers the only question of the cruise — over the top, straight through, or deviate?
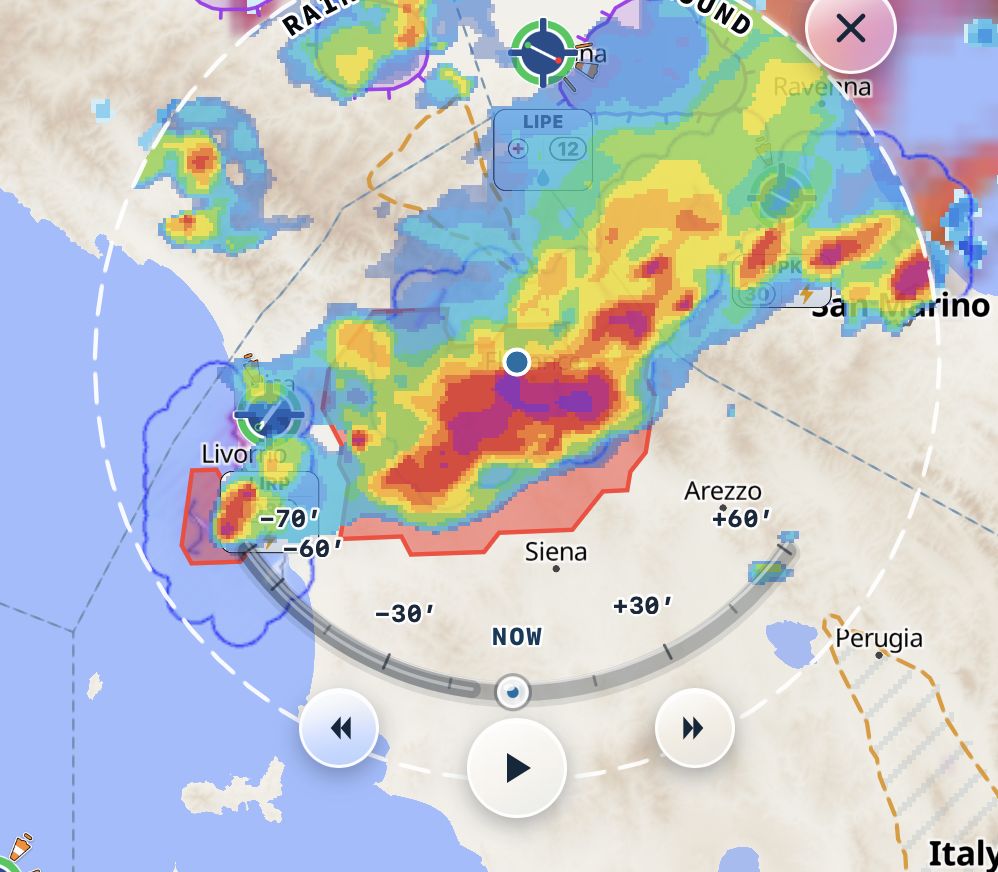
Rain reaching the ground
Around the destination aerodrome: a window from −60 to +60 minutes in 5 minute steps, scrubbed by hand on a timeline. Extrapolation projects the movement of the cells.
QNH and temperature ahead
At a destination aerodrome, how the parameters evolve over the coming hours — useful when the runway is short and the margin depends on air density.
Turbulence
A turbulence layer, explicitly marked experimental within the application. Situational awareness only: it is not intended to drive a level change.
03 — Aerodromes
The field.
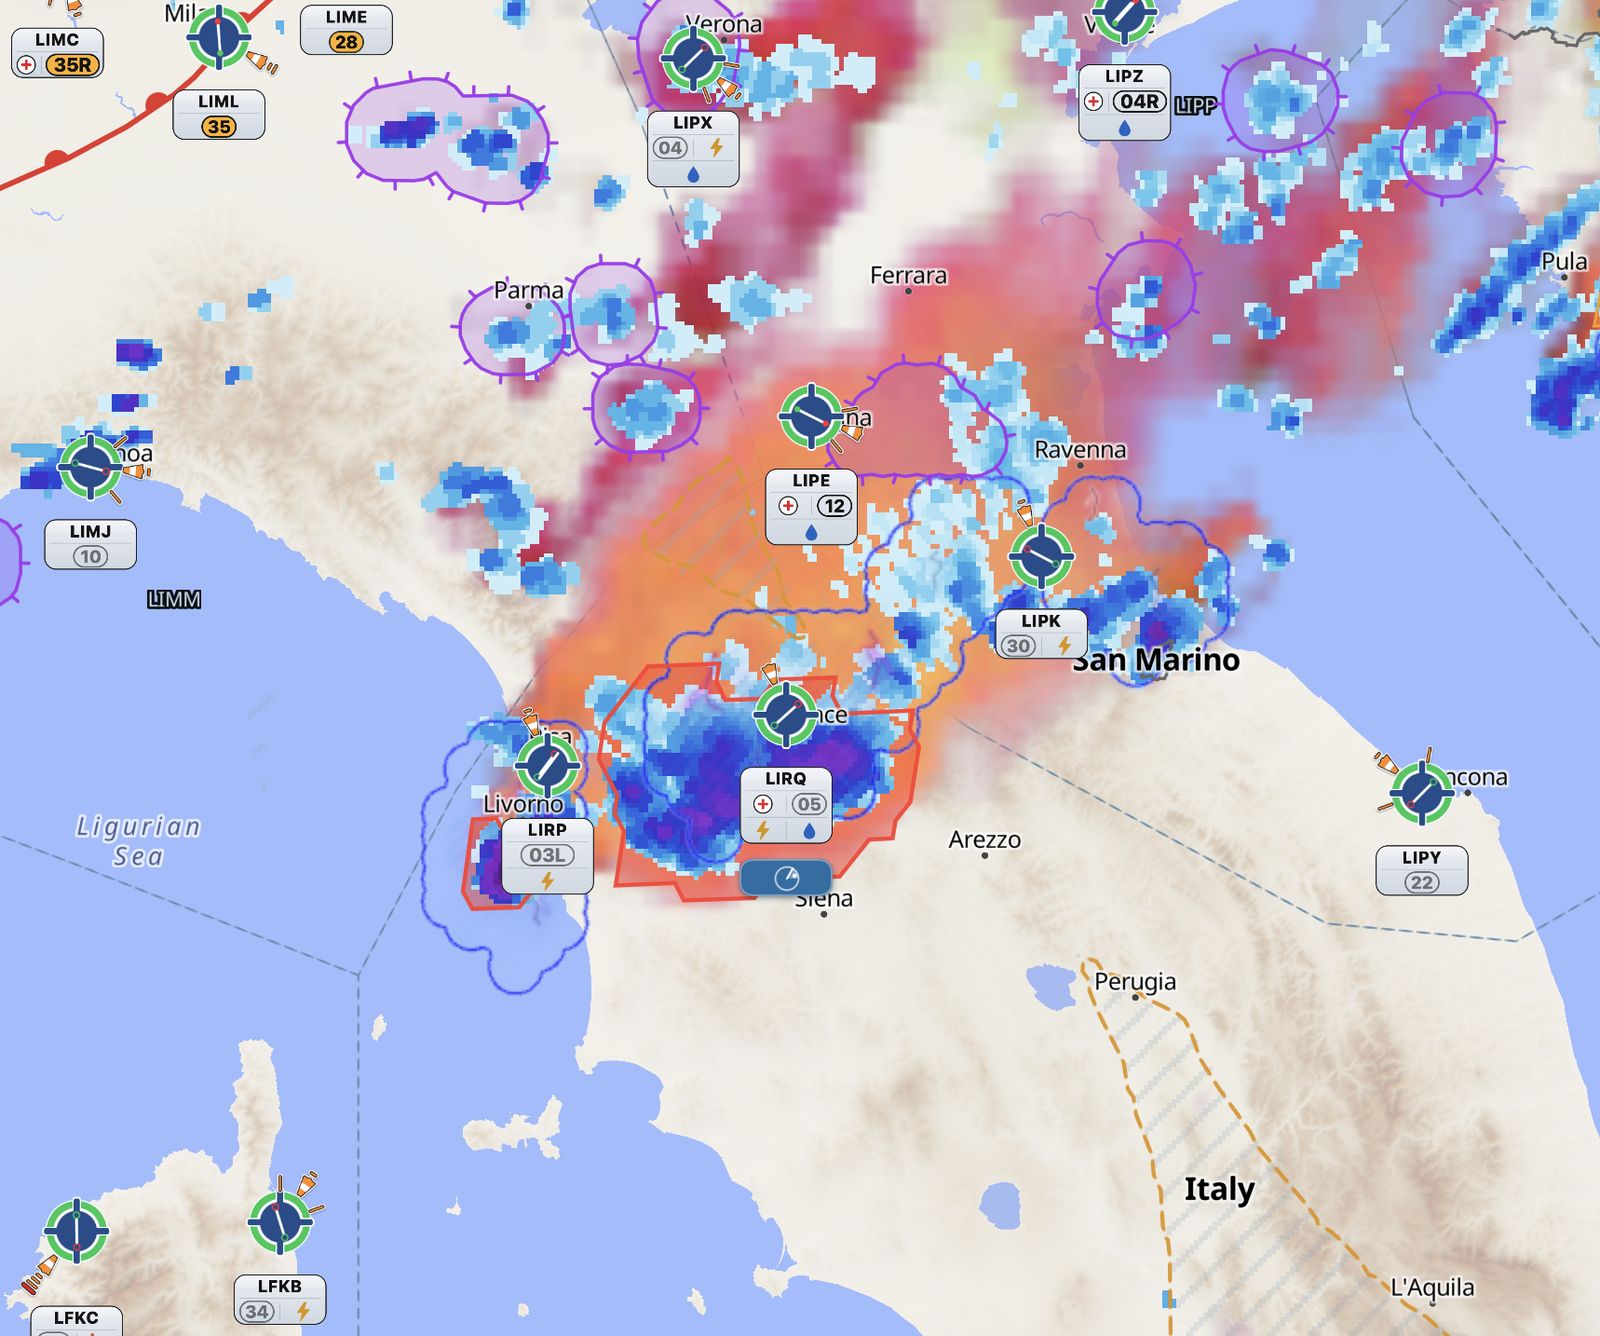
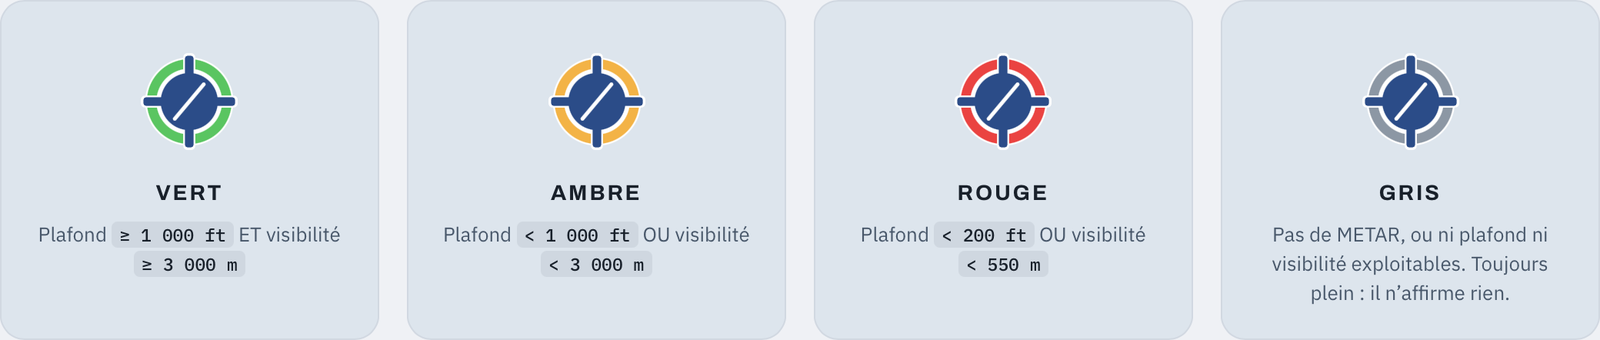
One marker per aerodrome, readable without opening it: the colour gives the minimum you need, the pictograms give the rest.
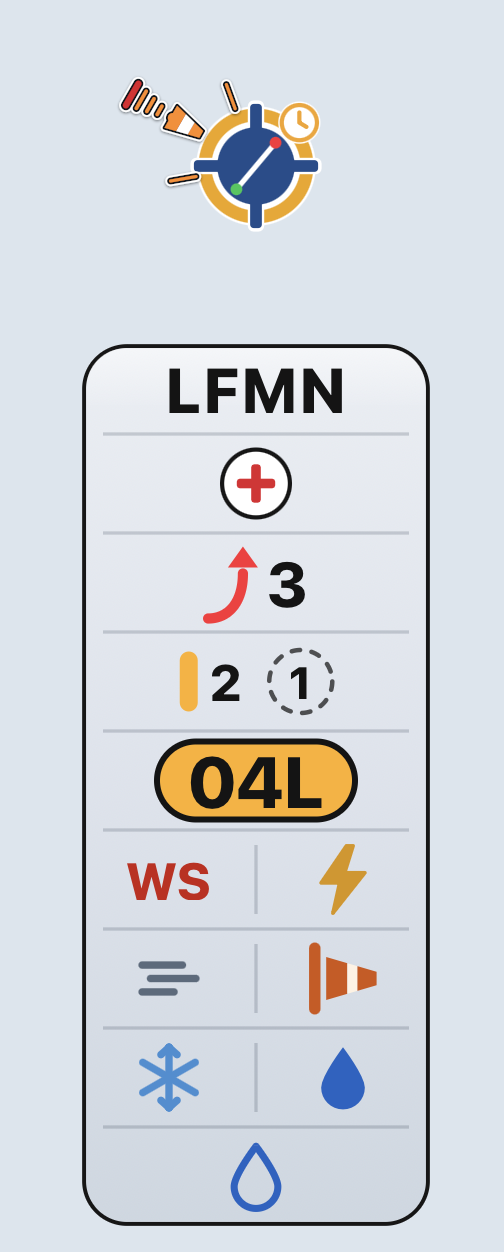
Green, amber, red, grey
Green: ceiling ≥ 1,000 ft and visibility ≥ 3,000 m. Amber: either one below. Red: ceiling < 200 ft or visibility < 550 m. Grey: no METAR, or no usable value.
Decoded METAR and TAF
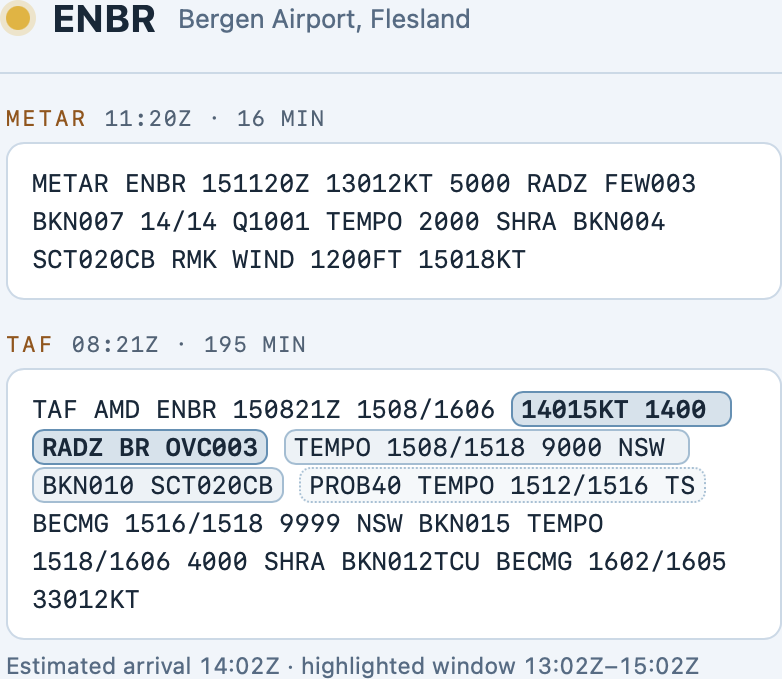
The raw message is decoded into plain language, the TAF follows in the same panel, and the estimated arrival window is highlighted within it. The age of the report is displayed — you always know how old what you are reading is.
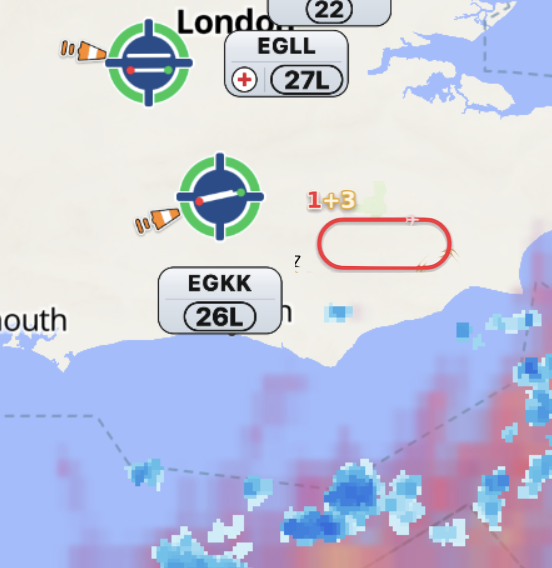
Runway in use, inferred from traffic
Rather than assuming it from the wind, the app watches low traffic on final and infers the runway actually in use. Shown in yellow, it warns of a tailwind to be expected.
NOTAM by aerodrome
Counted and sorted by type, full text from the panel. Flagging the NOTAM that actually matter is being opened up.
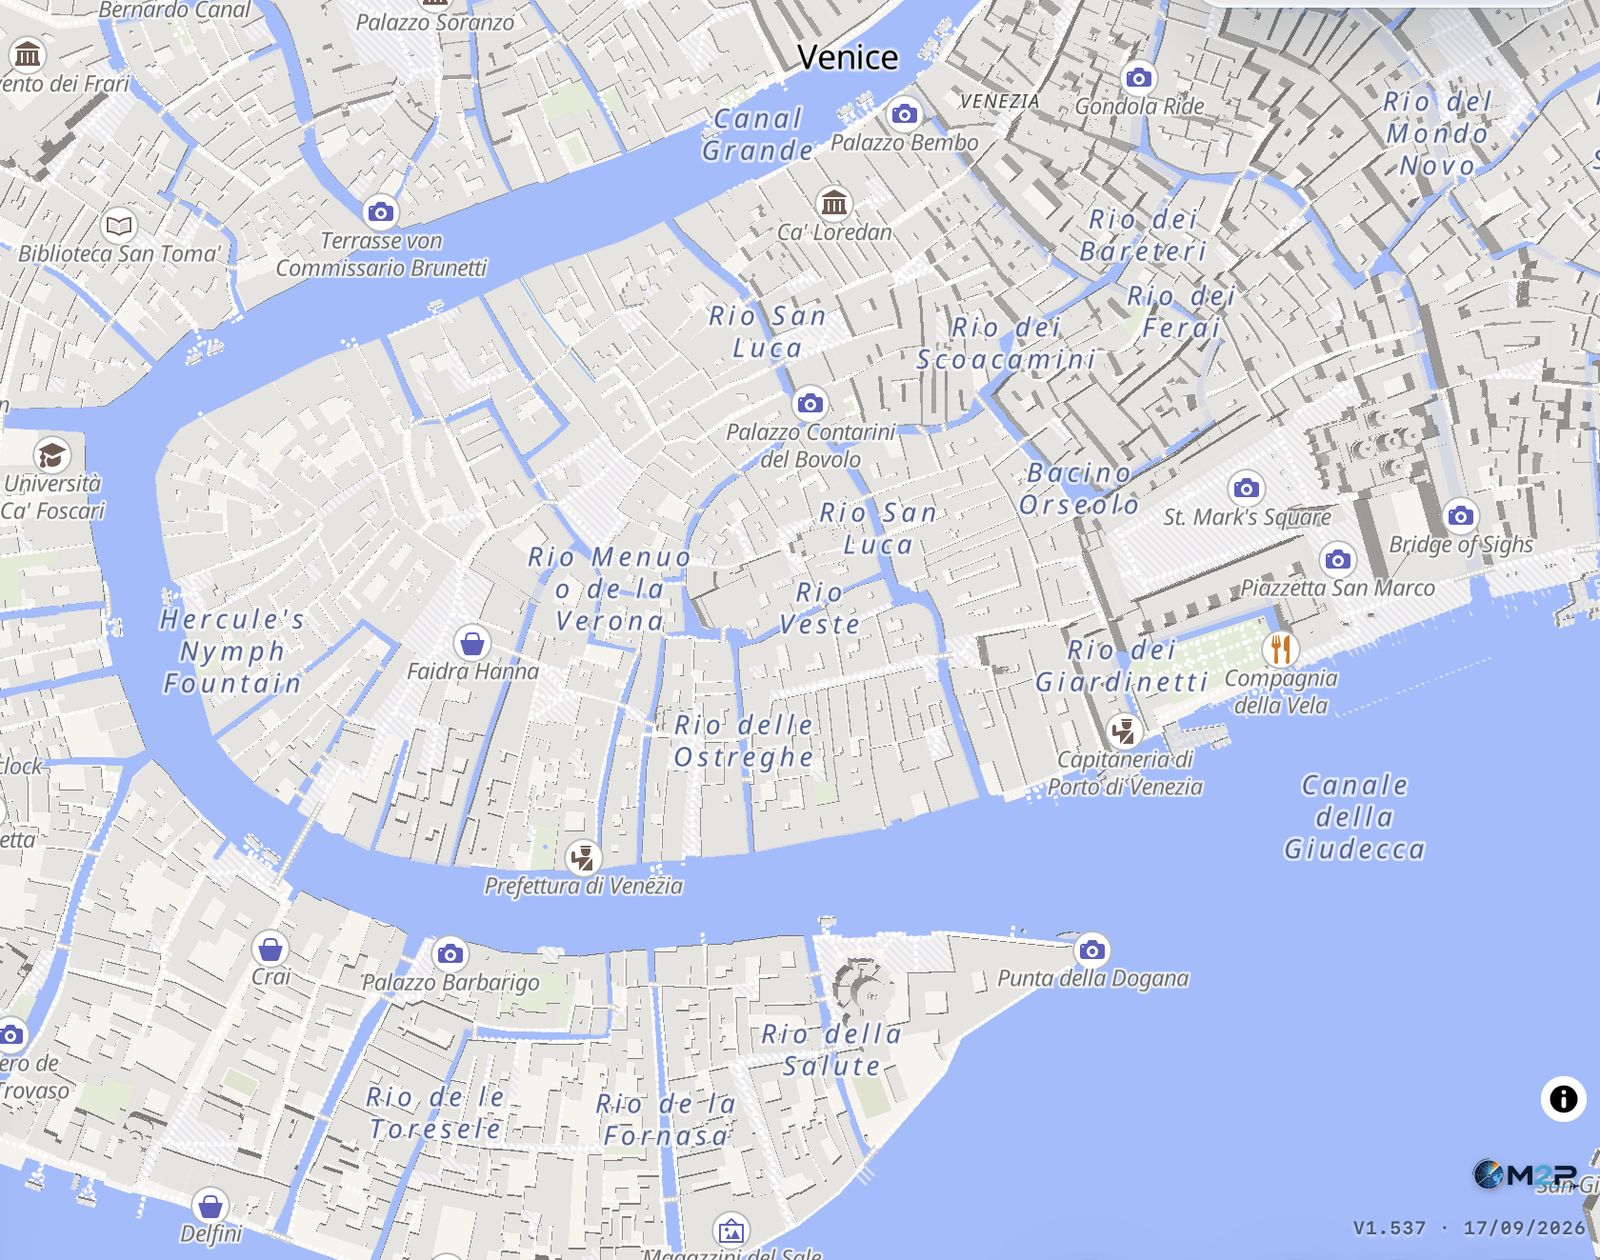
Ground map
The airport layout for taxi, in low or high definition. Useful in the cruise too, when the cabin asks what you are flying over.
VFR aeronautical chart
A VFR chart background (open flightmaps), provided as a preview and labelled as such in the interface: it does not replace the official chart.
Diversion
Where to divert,
and how long it takes.
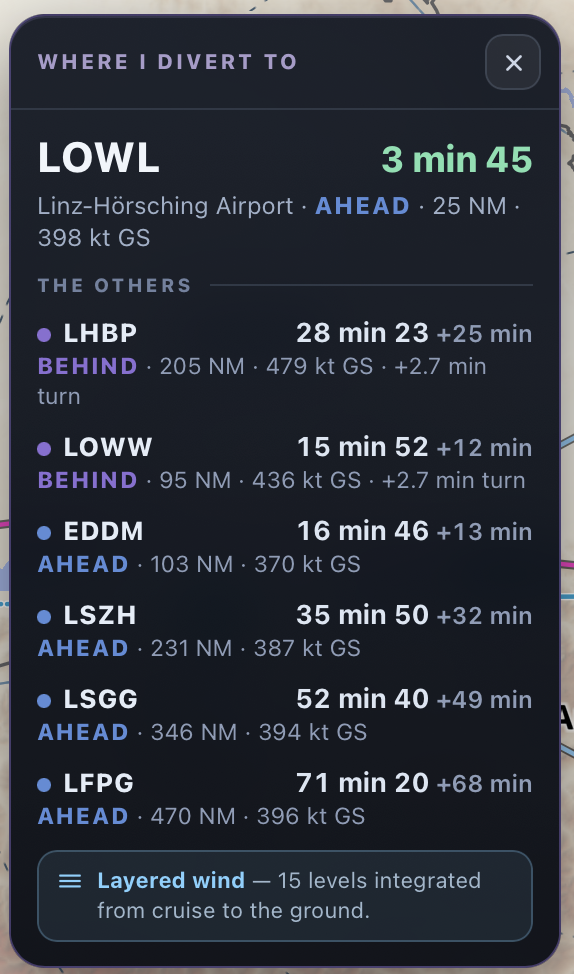
The nearest field in flying time is shown first; the others follow with their difference — ahead of or behind it — along with distance and the ground speed used. Turn time is counted in.
The calculation does not use an average wind: it integrates fifteen wind levels, from the cruise down to the ground. That is what separates an estimate from a figure you decide on.
04 — Navigation
Around
the aircraft.
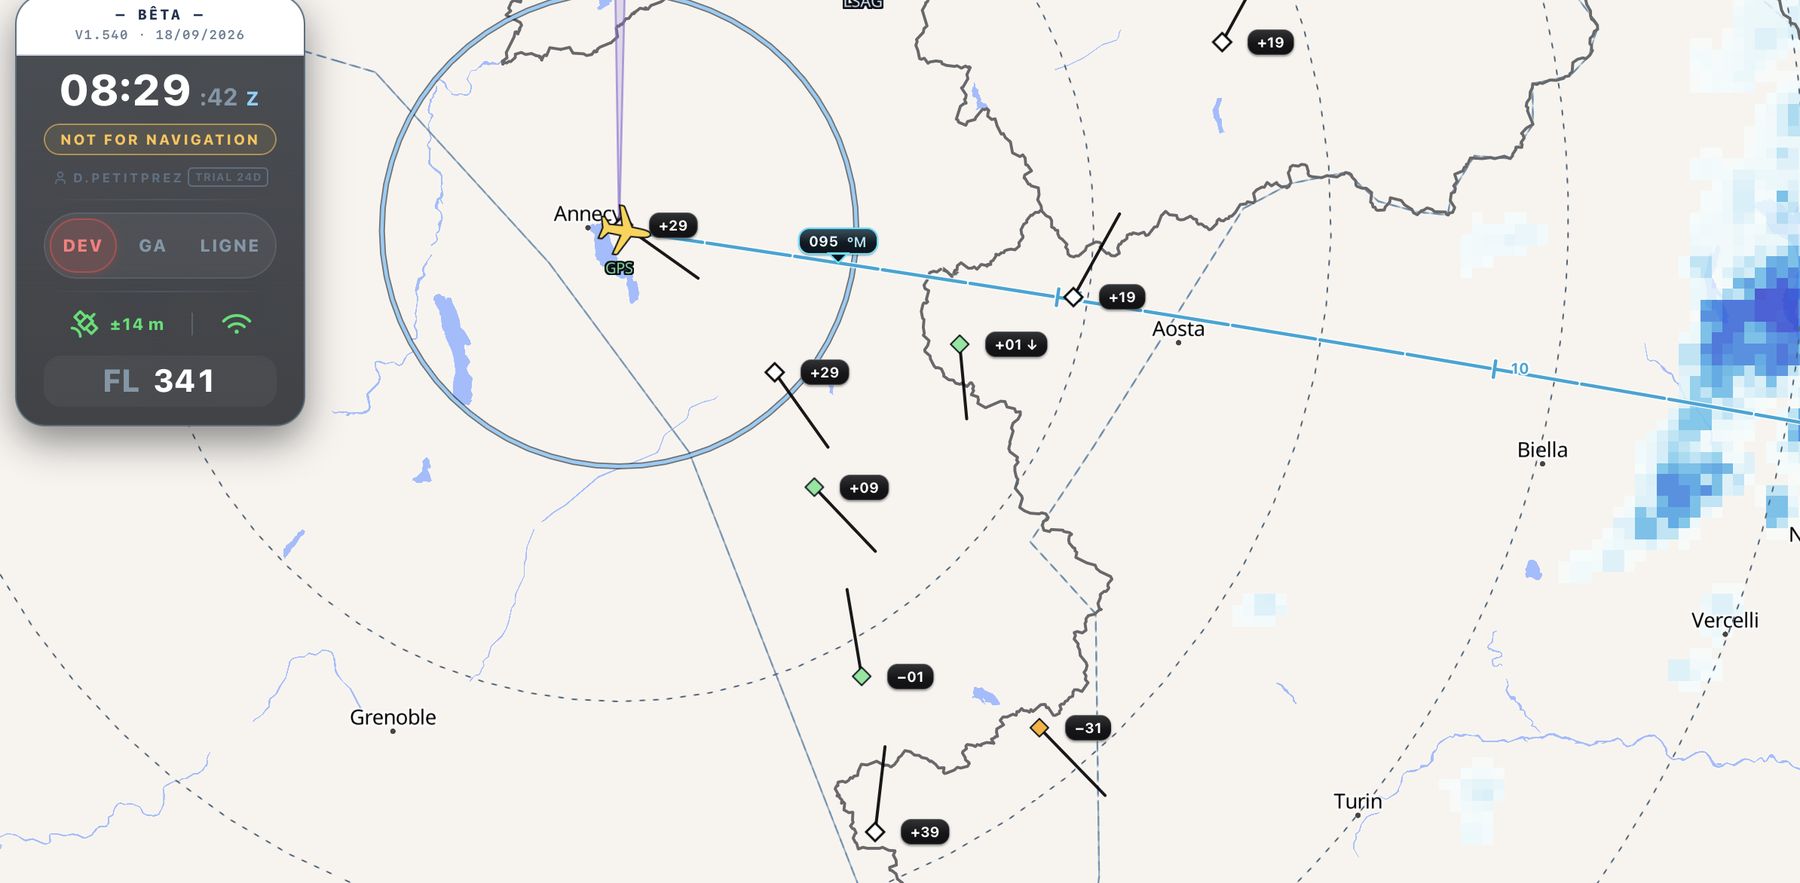
The map is always track-up and centred on position, with magnetic variation applied.
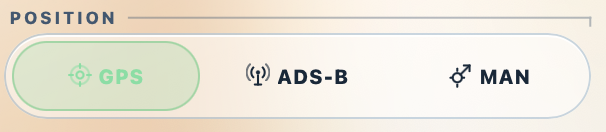
GPS, call sign, or by hand
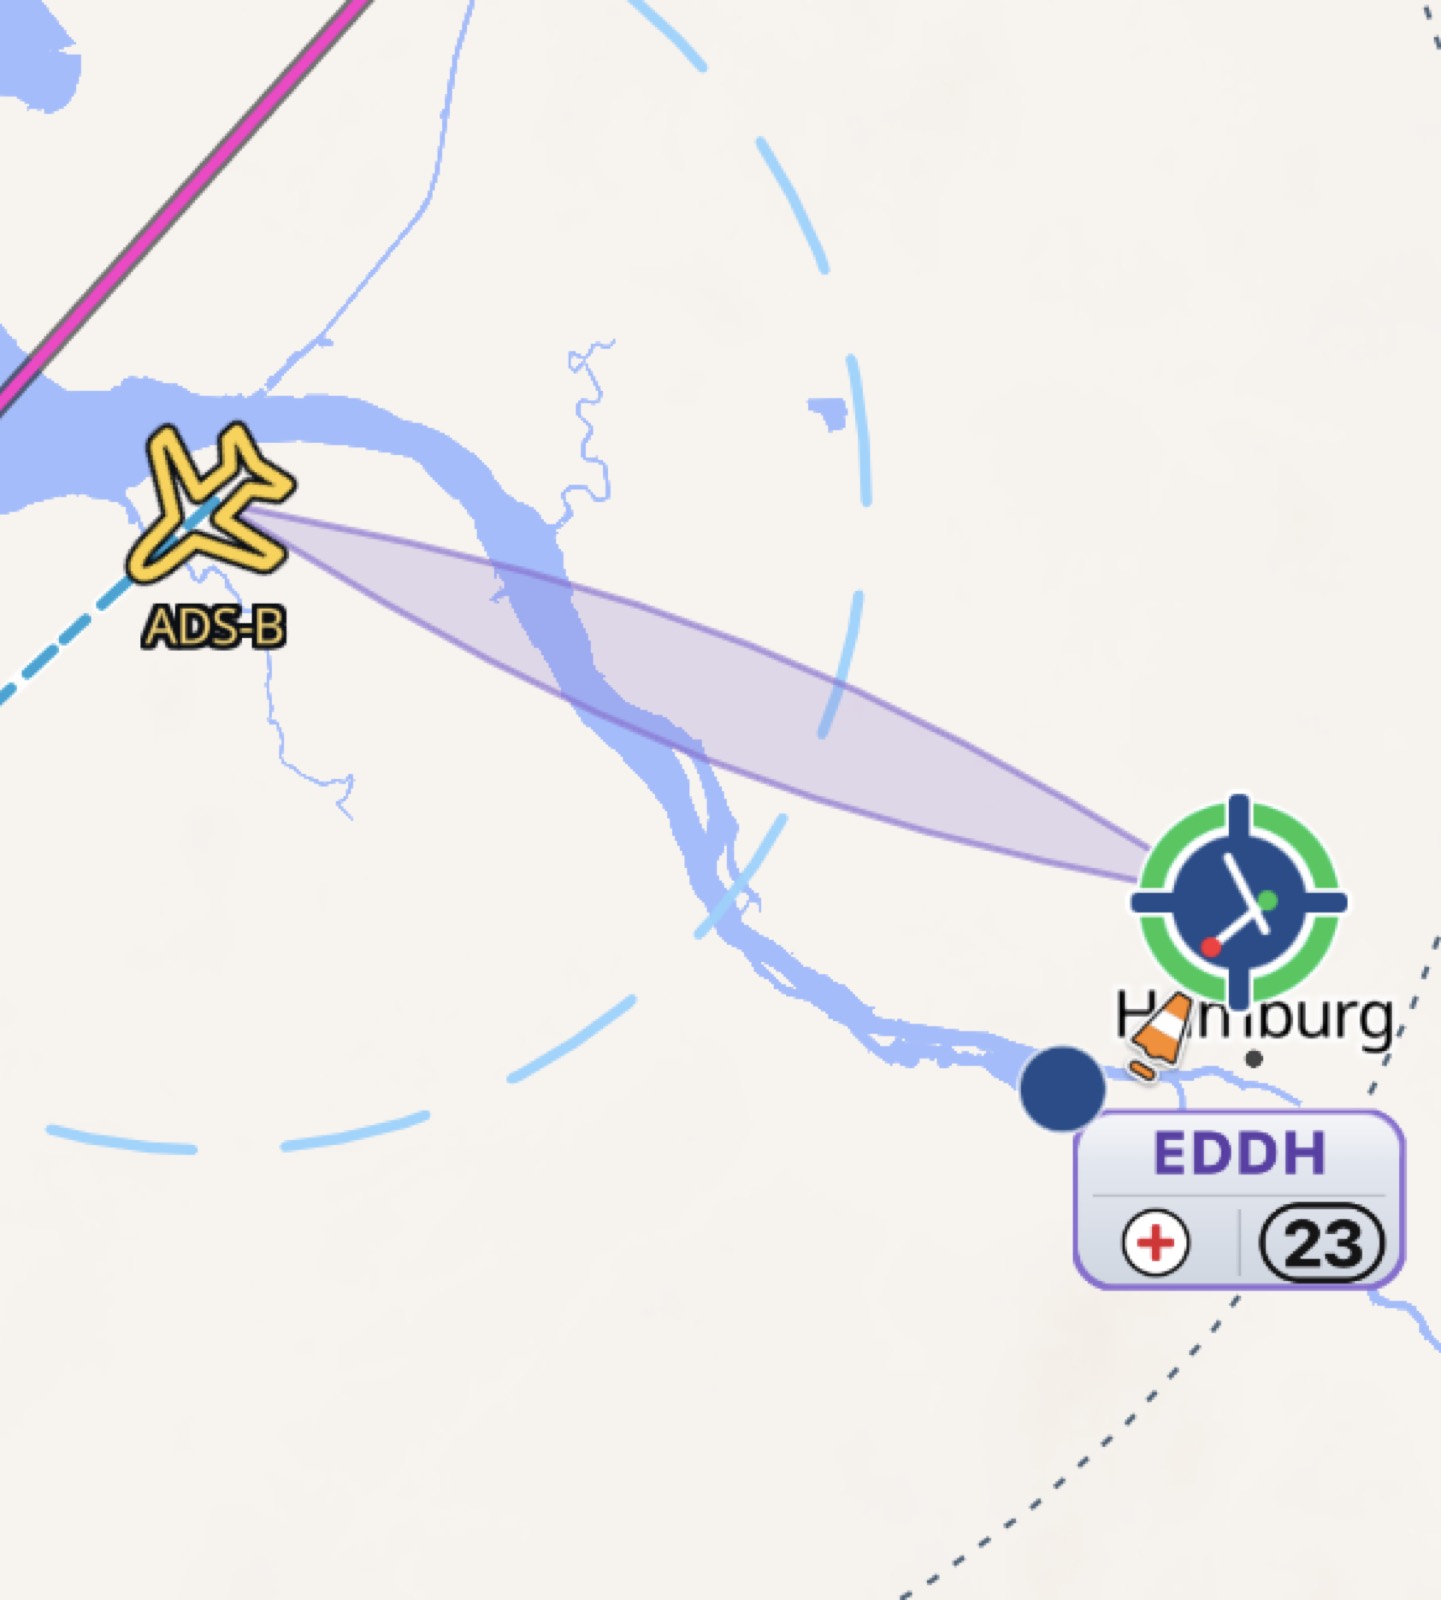
No GPS signal in the cabin? Enter your call sign and the position comes from ADS-B, or place the point by hand. A double tap draws a route for a new track — useful when planning a deviation.
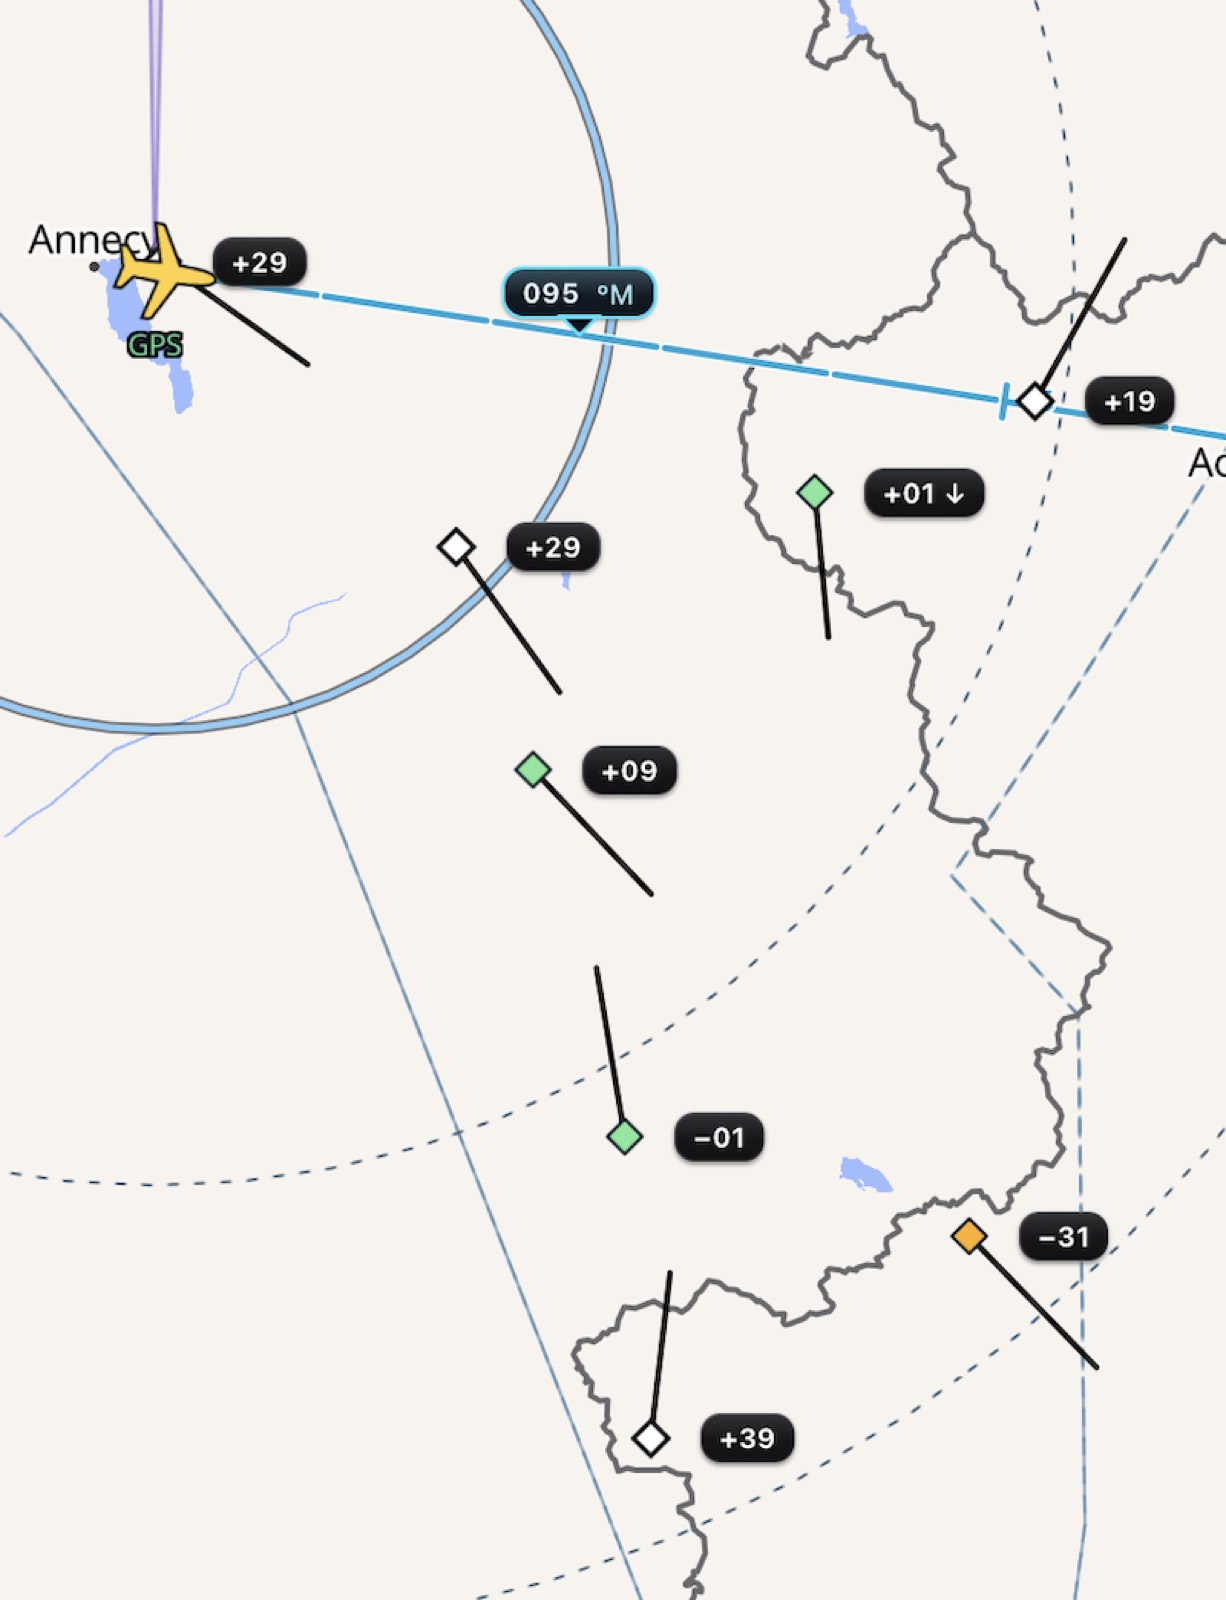
How the others are avoiding
Surrounding traffic with its level difference. This is not a TCAS, and the interface says so; it is, however, the most direct way to see where the crews ahead of you are actually going.
Holds in progress
Are aircraft circling over an area? The holding pattern is drawn on the map. In red, it signals an emergency in progress.
Route pasted from the OFP
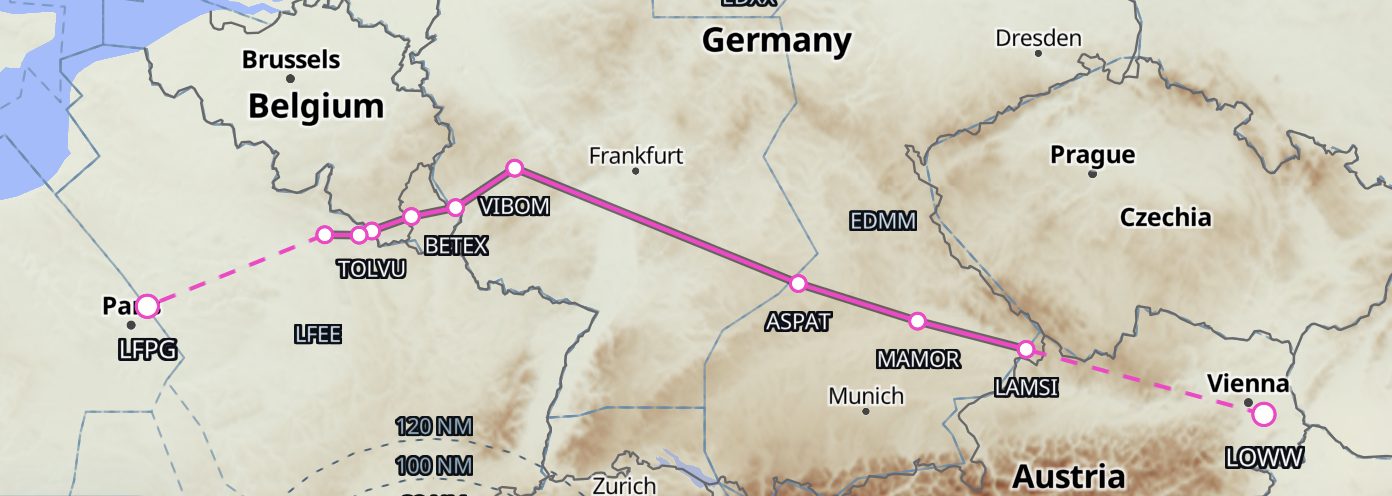
An ATC route or operational flight plan pastes in as it stands: the app resolves the points, draws the polyline, and every tool — cross-section, wind profile, diversion — attaches to it.
Equal time points
Between two diversion aerodromes, the point where flight time is the same either way — computed with the wind of the day, not on distance alone.
Weighted line and radial
A distance measure anchored to the reference aerodrome, dragged out with a finger, and a bearing and distance to any point. The gesture of the ruler on the paper chart, kept.

05 — In the cockpit
Built
for the flight.
A white screen costs you your night vision. The map goes dark with you.
Automatic night mode
The theme switches by itself with the time of day, and you can always force it. Basemap, layers and markers are recalibrated — not simply darkened.
The tablet is too far from your eyes
One tap, and the aerodrome markers grow without changing the map scale. You keep the overview and still read the runway in use.
Installable web app
Nothing to download from a store, nothing to update by hand. The page installs to the home screen and behaves like an app, keeping the screen awake.
The age of the data, always on show
Every layer displays how long ago its data was produced. Stale data is discarded before display rather than shown without comment.
Sources
What each one
measures — and not.
Met2Pilot produces no weather data of its own. It gathers, reprojects and presents public or licensed products. Attribution stays on the map at all times.
- EUMETNET OPERA
- NOAA / NESDIS — ERR
- EUMETSAT MTG-LI
- EUMETSAT — RGB Convection
- EUMETSAT NWC SAF — RDT
- Deutscher Wetterdienst
- Open-Meteo — GFS model
- NOAA / NWS — Aviation Weather Center
- adsb.lol
- FAA / Notamify
- open flightmaps
OPERA measures radar reflectivity in dBZ — the echo returned by droplets and particles aloft. Not rainfall at ground level, because that is not the relevant use here.
MTG-LI measures optical flash area seen from above, accumulated over five minutes. Neither a strike location nor a flash count.
ERR estimates a rainfall rate from the infrared channels of five geostationary satellites: an observation of cloud tops, filling gaps in radar coverage without replacing it.
The attribution each licence requires is carried by the map's attribution control, verified at five screen sizes. These credits imply no endorsement of the service by the providers named.
Access
One month free,
then €29 a year.
No password: an email address, a six-digit code, and the session stays open.
€29 / year
Net price. VAT not applicable, article 293 B of the French General Tax Code. The first month is free with no commitment. Payment is handled by Stripe; no card details are retained by the publisher.
Where the money goes
High-quality data, from official meteorological sources. Those feeds are metered: every map you open is billed to us.
No ads, no data resale, no third-party trackers, no audience measurement. Your account stays in the EU: database in Frankfurt, servers in Germany.
The service is in beta. Institutional access and further operators will follow. The terms of use published on met2pilot.com are the contractual document and prevail over this page.